
Most litigators who have benefitted from participating as counsel in a few trials can assess, with reasonable confidence, whether their client has a "strong" or a "weak" case. However, if one asked them whether they could frame their forecasts as a range of potential damage awards, or a range of likelihood of an acquittal, with a reasonable confidence level, many litigators demur from making such a forecast. Yet, increasingly, sophisticated parties demand these forecasts. Insurers ask for realistic estimates rather than "worst case" estimates of reserves they need to set aside. Litigation finance must assess the likelihood of recovering a sum of damages that reflects the risks of loss. Our trade publications are rife with articles about clients who demand greater transparency into how litigators develop their forecasts.
The Role of Decision Analysis
Decision analysis is a discipline with universal use in other fields such as operations research, finance, project management, among many others. Whenever a person needs to forecast the likelihood of an event that is dependent on a chain of events, each link of the chain having a range of likelihood of occurrence, those professionals will employ decision analysis tools. A wonder that lawyers, whose stock and trade is in the analysis of uncertain events, have not embraced these techniques. It's high time we did.
The Decision Tree
A decision tree is a model of a series of event points having a range of potential outcomes. Lawyers have defined "decision points" for generations. For example, in the case of a negligence claim, we need to convince a judge to make a decision on certain known questions, put simply: (1) did the defendant owe the plaintiff a duty of care? (2) what was the standard of care? (3) did the defendant act below that standard? (4) was there an injury? (5) did the defendant's failure to meet the standard of care cause that injury? For simplicity's sake, we will leave out the issue of defences. Knowing the evidence, lawyers can identify the likelihood that each of those elements can be proven. With that capability, each of those questions becomes a point in a decision tree.
Here is an example of such a tree:
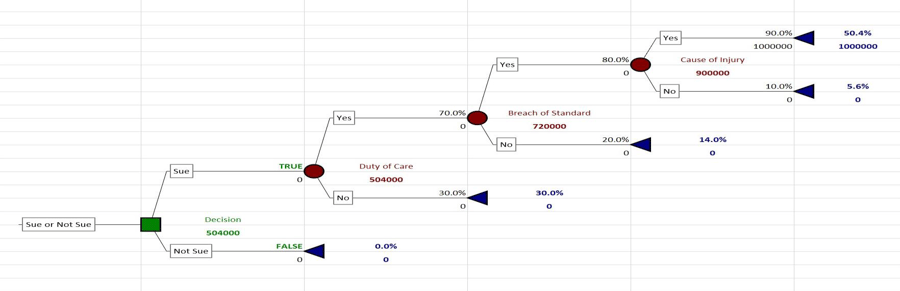
In this example, the Plaintiff claims $1,000,000 in damages. Each of the nodes on the tree represents an element of the negligence claim. The tree posits that the Plaintiff should value his claim as $504,000. If the Defendant's counsel had the same tree, the Defendant would be advising an insurance adjuster to set aside $504,000 in reserves. A litigation finance lender would set their target return at $504,000 and provide their funding accordingly to the expected return. The plaintiff's counsel (or the mirror advice for defence counsel) would be thinking that if the Defendant offered anything higher than $504,000, then the Plaintiff should accept that settlement offer. Defence counsel would obviously offer the mirror advice: the Defendant should agree to pay anything less than $504,000.
The Monte Carlo Simulation
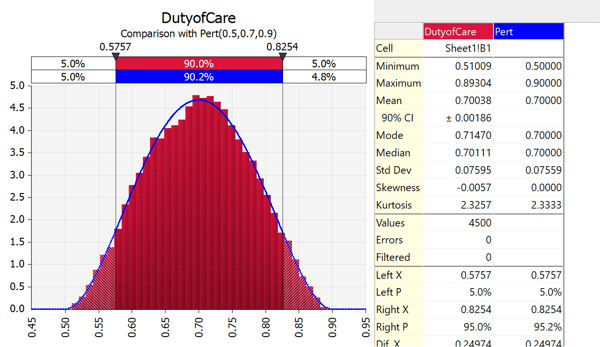
But, you may say, "It's impossible to be so precise in putting a number at each of those nodes! It's more like a range of probabilities!" Decision analysis allows for this: the Monte Carlo simulation - a technique developed by theoretical physicists trying to develop the atomic bomb. The word "Monte Carlo" refers to the codename that US government scientists gave to the technique rather than to the suggestion that the technique necessarily results in random results or is a form of gambling. The lawyer assigns to each node a range of reasonable outcomes for that node. In most cases, a node represents a discrete and often binary condition: "Yes" or "No". As in, did the Plaintiff prove that the Defendant owed the Plaintiff a duty of care: "Yes" or "No" - unlike lawyers, a judge does not have the luxury of "Maybe". In our example, the lawyer has defined the likelihood that a judge will decide that the Defendant owes the Plaintiff a duty of care as being 70% plus or minus 20%.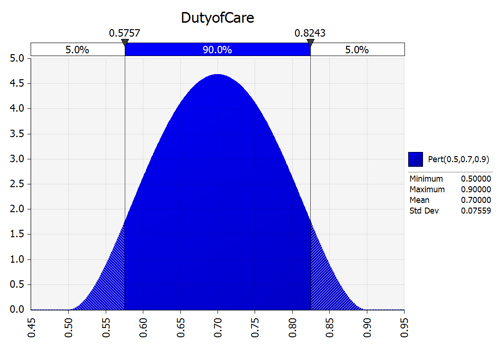
Just what does this figure mean? One way of putting it is that if we ran this trial in front of 100 judges, we believe 70 judges would agree that the Defendant owed the Plaintiff a duty of care and 30 judges would not. We acknowledge that this is a form of legal realism and not formalism. We are recognizing that judges are human and are prone to seeing cases differently from each other. In setting a range of likelihood around 70% however, we are recognizing, horror, that we could be wrong! Rather, we could be underestimating our chance of success or as is the general case with most lawyers, overstating our chance of success. Here is what the node looks like now:
Now, we run the Monte Carlo simulation. We recalculate the results of this tree while we change all the percentages for each node simultaneously. Running this kind of exercise meaningfully requires tens of thousands of iterations. This exercise cannot feasibly be done by hand. But, thanks to computers, we can run this simulation in a few seconds. As it turns out, to reach a point where we had "stability" - that is where the final result tended to repeat themselves - the computer had to run 4500 iterations of this example model. Here are the results:
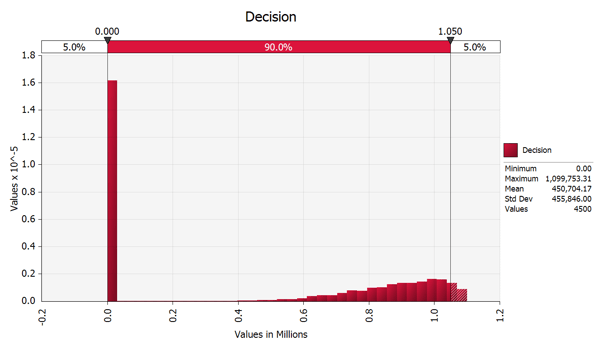
As it turns out, there is a pattern to the results, one that is readily discernible to clients, insurance professionals, and financial managers. The chart shows a 45% chance of loss and a range of likelihoods of relatively low magnitude, which we can visually see starts at around $600,000 to just over $1,000,000. The average across all these results is $450,704, slightly lower than our static model. We note that in this model, we had modelled our range of damages as being somewhat more pessimistic that we could prove entitlement to $1,000,000 but rather where the range skewed downward while forecasting a small chance that we could earn more than $1,000,000:
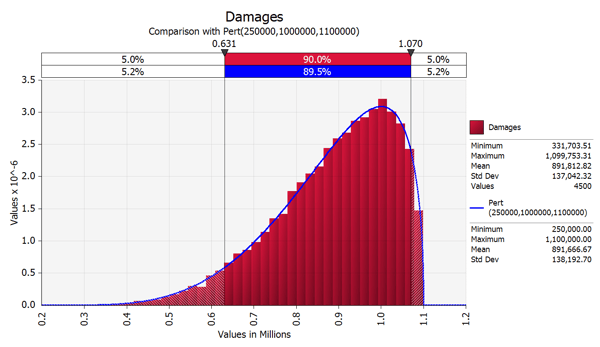
There is a chart for each of the nodes that allow us to verify that the computer used truly random inputs into our model:
This chart presents the effect of changing one node has on the final result. The longer bars illustrate variables that have a greater effect on the final outcome. We use this graph to help recommend to the client where to focus a limited litigation budget (hint: after spending enough resources to satisfy that we can prove, minimally, all elements, we focus remaining budget on proving those elements with the greater impact on the final result):
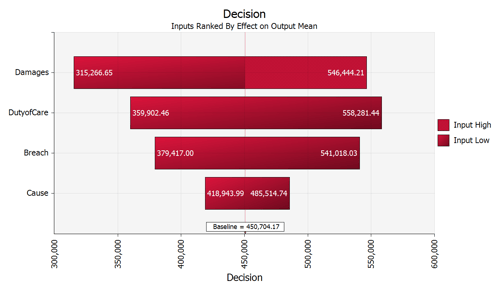
The graphs suggest to us that if we had any surplus budget - we should spend that money on proving damages and proving the existence of a duty to care and proving the breach. Proving causation had less of an effect on the final result.
Better Decision-Making
This note scratches the surface of how this technique is used and its power. We have used these techniques in helping clients understand whether to pursue litigation, helping accused persons know where to best deploy their defence budget to attach the Crown's case, to formulate settlement and mediation positions, and to justify legal budgets with professional funders. After having used these techniques for several years, we can attest to their power not only in helping us make more rigorous and disciplined decisions, but its power to help clients see our work.
These techniques are commonplace in many areas of advanced business. Executives responsible for selecting major capital projects, sending people to space, deploying major population - wide health programs routinely procure these studies to inform their decisions. In all cases, these executives are seeking to forecast risk and opportunity. Lawyers are forecasters of risk and opportunity. We can mitigate risk and maximize the opportunity for our clients with legal tools. We should adopt these tested techniques that have been pioneered and used in many other industries.
For more information about these techniques and how we apply them to our practice, please contact Chilwin Cheng.